
Google Ads Cost Per Lead by Industry in 2026: What Triangle Service Businesses Should Actually Pay
What a lead really costs in legal, dental, HVAC and home services in 2026 — plus the number your agency would rather you didn't calculate.
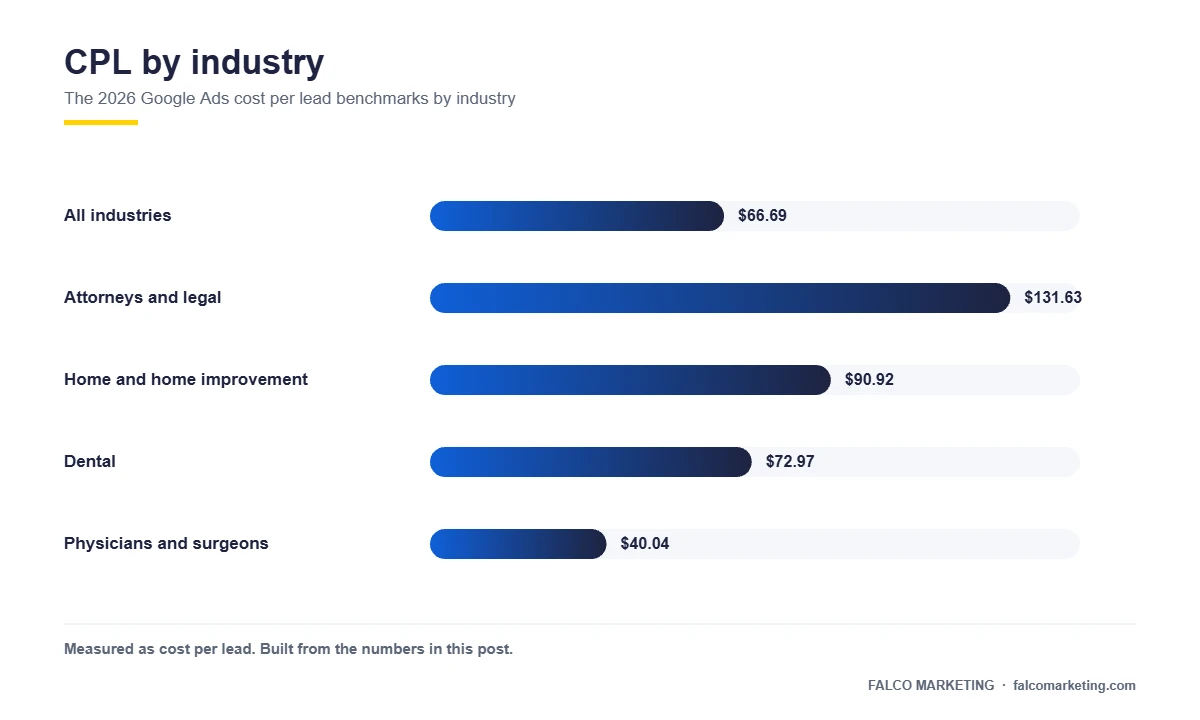
The median cost of a lead on Google Ads, across every industry, is $66.69. Law firms pay $131.63. Roofers, HVAC companies, remodelers and everybody else filed under home improvement pay $90.92. Dental practices pay $72.97.
Those are medians pulled from 13,474 US search campaigns, which makes them the closest thing to a peer group you’re going to get. Your competitors aren’t going to tell you what they pay. Your agency will quote you whatever benchmark makes this month look reasonable.
So if you’re paying double the number for your category, you have a real question to ask on your next call. And if you’re paying half, be careful. The likelier explanation is that something in your tracking is counting form loads or repeat callers as leads, not that you’ve quietly beaten the national median.
Google Ads cost per lead by industry in 2026: $66.69 across all industries, $131.63 for attorneys and legal, $90.92 for home and home improvement, $72.97 for dental and $40.04 for physicians and surgeons. Those are medians from 13,474 US search campaigns. Raleigh businesses generally land near the national median, and cost per booked job matters more than any of them.
The 2026 Google Ads cost per lead benchmarks by industry
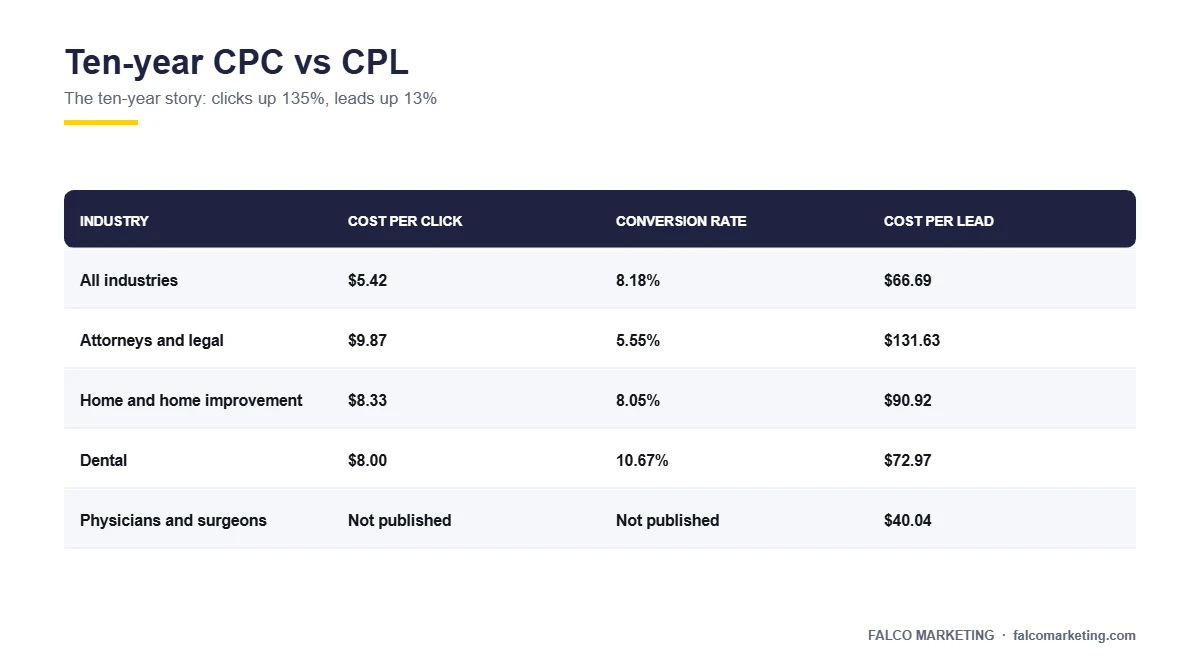
Here’s the table. Read the conversion rate column before you get upset about the cost per lead column.
| Industry | Cost per click | Conversion rate | Cost per lead |
|---|---|---|---|
| All industries | $5.42 | 8.18% | $66.69 |
| Attorneys and legal | $9.87 | 5.55% | $131.63 |
| Home and home improvement | $8.33 | 8.05% | $90.92 |
| Dental | $8.00 | 10.67% | $72.97 |
| Physicians and surgeons | Not published | Not published | $40.04 |
Caption: Medians from 13,474 US search campaigns, April 2025 through March 2026. Source: WordStream/LocaliQ 2026 Google Ads benchmarks.
Look at legal and dental together. A dentist and a lawyer pay almost the same for a click, $8.00 against $9.87. The lawyer pays 80% more per lead. The entire gap is conversion rate: dental converts at 10.67%, legal at 5.55%. Somebody with a toothache is ready to book. Somebody researching a wrongful death claim is going to read for two weeks first.
That’s the useful lesson in the whole table. Your cost per lead is mostly a story about what happens after the click.
How to use this table without embarrassing yourself
Four ways owners misread benchmark data, and two of them end with an angry email to an agency that didn’t do anything wrong.
These are medians, not averages. Half of all campaigns sit above the line by definition. Landing above it doesn’t prove anything is broken. Somebody has to be in the top half.
The spread inside a category is enormous. “Home and home improvement” holds gutter cleaning and full roof replacement in the same bucket. A $400 job and a $22,000 job do not compete for the same clicks at the same price.
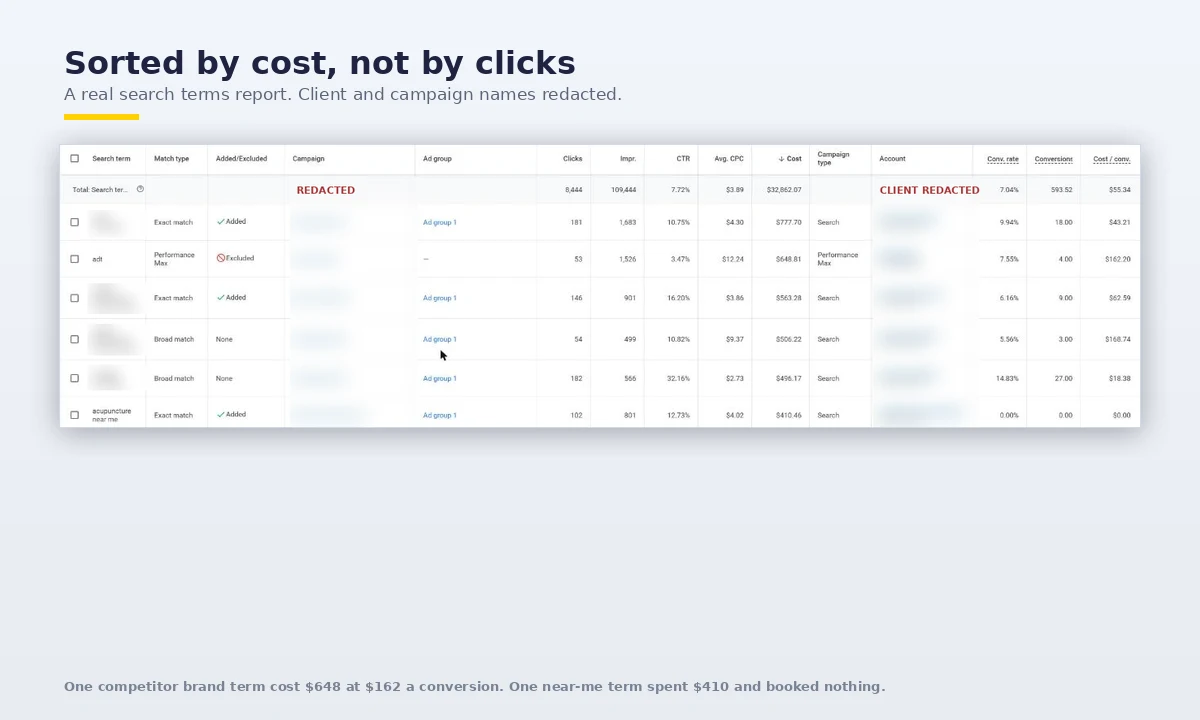
Blended numbers hide everything worth knowing. If you run brand search alongside “emergency ac repair near me,” your blended cost per lead is being dragged down by people who were already searching your name. Pull brand out and look at the rest. That’s the number your growth actually depends on. Our walkthrough of a Google Ads report shows you where to find that split without asking anybody’s permission.
And none of it says anything about lead quality. Two roofers can post identical cost per lead and one of them is buying tire-kickers. The benchmark measures what a lead costs, not what a lead is worth.
The categories that don’t exist in the benchmarks
Nobody publishes a pest control benchmark. Or home security. Or audiology. The categories that get reported are the ones with enough campaign volume to be statistically honest, and half the businesses we work with in the Triangle fall outside them.
So use a proxy and be honest about the error bar.
Pest control and home security both behave like home improvement, so start at $90.92 and expect to come in under it. Ticket sizes are smaller, the bidding is less brutal than roofing after a hailstorm, and recurring contracts mean a lead is worth defending. If your pest control cost per lead sits near the home improvement median, you’re probably fine. If it’s above it, look at your negatives before you look at your bids.
Audiology and chiropractic sit closest to physicians and surgeons at $40.04, but that number covers a lot of high-volume primary care. Both categories run on a small number of expensive intent keywords, so treat $40.04 as a floor rather than a target. A chiropractor paying $60 a lead in Cary is not being robbed.
Nobody can tell you the exact figure for your category, because it hasn’t been measured. Anyone who quotes you one is making it up.
The proxy is a starting point, not a verdict
If your category isn’t in the table, don’t fire an agency over a proxy number. Use it to decide whether the conversation is “we’re roughly where we should be” or “something is wrong and we need to find it this week.”
The ten-year story: clicks up 135%, leads up 13%
This is the stat that reframes the entire complaint.
In 2016 the average cost per click across Google Ads was $2.32. In 2026 it’s $5.42. That’s a 135% increase in ten years, and it’s the number every owner feels in his gut when he opens the invoice.
Over the same ten years, average cost per lead went from $59.18 to $66.69. Up 13%.
Clicks got dramatically more expensive. Leads barely moved. The gap got absorbed by better conversion rates and landing pages that stopped being brochures.
Which means the honest read on “Google Ads got so expensive” is that Google Ads got more efficient and the price of admission went up. If your cost per lead has climbed 100% since 2016, that’s not the market. That’s your account.
2026 is the first cost per lead decline in five years
For the first time in five years, average cost per lead across Google and Microsoft Ads went down.
Not because clicks got cheaper. They didn’t. Conversion rates improved, and the categories that improved most are ones you’d recognize. Dental cost per lead fell 13.1% year over year while dental conversion rate climbed 17.5%.
Meanwhile legal cost per click jumped 15.0%, from $8.58 to $9.87. Home improvement clicks rose 6.1%.
Read those two facts together. Clicks kept getting more expensive in the categories with the most competition, and the accounts that got better at converting absorbed it. The accounts that didn’t ate the increase.
Where the money leaks
Now the part your agency’s monthly report leaves out.
WordStream looked at 251,236 reports from 15,666 accounts and found the average account wastes $1,127.54 a month out of $3,127.38 in spend. That’s 36% of the budget going to searches that were never going to turn into a customer. About $3,383 a quarter.
The same study found that 29% of accounts recorded zero conversions over 90 days. Not a bad quarter. Zero. And 25% have never added a single negative keyword, which is the closest thing to a smoking gun you’ll find in this business.
Here’s why negatives matter more than anything else on this list. Accounts with at least one negative keyword average a 13% monthly conversion rate. Accounts without one average 4.6%. Nearly triple, from the least glamorous task in the account.
There’s one more finding worth sitting with. Accounts spending under $1,000 a month convert 32% better than accounts spending over $10,000 a month, 18.8% against 14.2%. Small and disciplined beats big and sloppy. That’s good news if you’re a two-truck operation in Fuquay-Varina.
Want to know where your account sits?
Send us your last three months of Google Ads data. A CSV export works, or add us as a read-only manager for a week. We’ll send back a one-page benchmark showing your cost per lead, your cost per click and your conversion rate against your industry’s medians, plus the three biggest sources of waste we find. You keep the document whether or not you ever talk to us again.
Get a Google AuditTakes about 20 minutes of your time. No proposal, no follow-up sequence.What Local Services Ads cost instead
If you’re a contractor, the comparison you actually want is against Local Services Ads.
SearchLight analyzed 888 contractors, $6.72 million in spend and 126,650 leads and found a blended cost per lead of $53. Electrical came in at $39, HVAC $51, plumbing $57 and drain and sewer $59.
Against $90.92 for home improvement on search, that looks like a rout. It isn’t apples to apples.
An LSA lead is a phone call or a message request, and a meaningful share of those calls are wrong numbers or homeowners outside your service area. You can dispute them, but you have to actually do it. A Google Ads lead is usually a form fill or a call from someone who read a page about the exact service they want. Different raw material.
Also worth knowing before you rebuild your plan around LSA: Google is folding Local Services Ads into Google Ads starting in August 2026 for home and storefront service advertisers, including plumbing, HVAC, electrical, roofing and pest control. The separate LSA dashboard goes away and your historical performance reports don’t come with you. Manual bidding is eliminated too. Export your history now, before August, not after. We went through the tradeoffs in more depth in Local Services Ads vs. Google Ads vs. SEO.
Facebook leads cost less. That’s not the same as better.
Cost per lead on Facebook lead campaigns runs $27.66 across all industries. Legal is $18.17. Home improvement is $41.26.
A legal lead for $18.17 against $131.63 on search. That’s a seven-to-one difference, and it’s the slide every social media agency in Raleigh opens with.
The part they skip: a Google lead typed “car accident lawyer raleigh” at 11pm. A Facebook lead saw an ad between a birthday post and a video about a dog. One of those people has a problem right now. The other might.
Dental is the interesting exception. Facebook dental leads cost $76.71 against $72.97 on search, so the cheap-lead argument evaporates entirely.
Use Facebook where the offer creates the demand, not where the demand already exists. It’s a good channel for a year-end benefits push or a new-patient special. It’s a poor substitute for someone searching “emergency ac repair” in July.
The number to actually track: cost per booked job
Cost per lead is the wrong number. It’s the one agencies report because it’s the one they control.
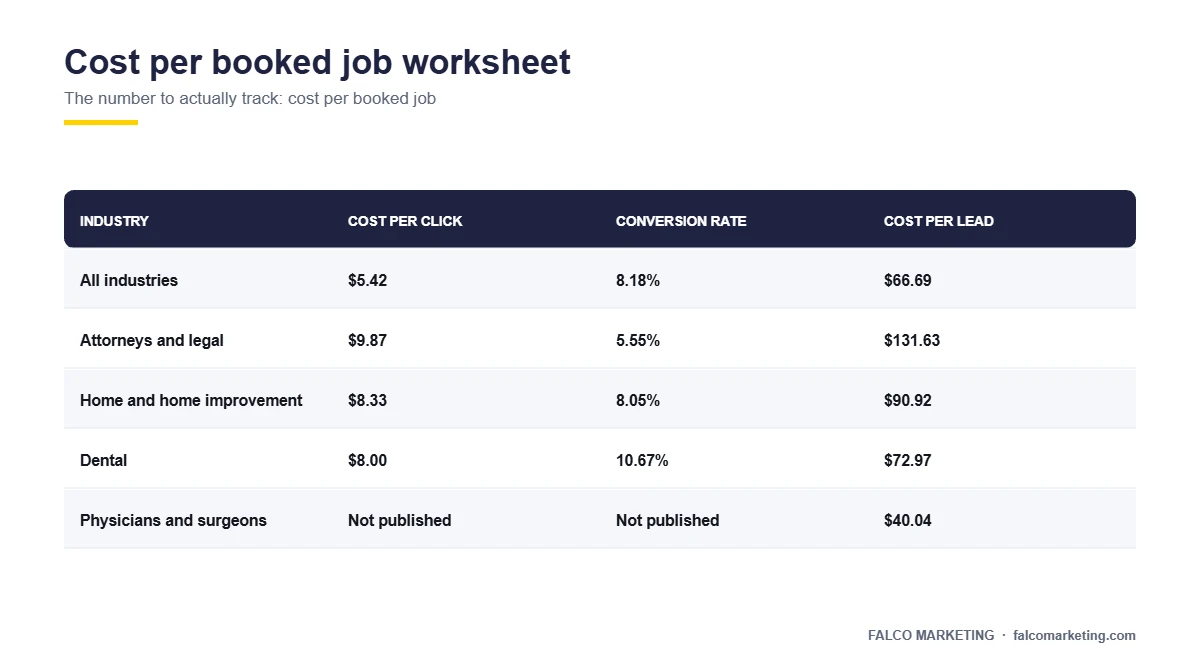
Cost per booked job is the number that pays payroll. Run it yourself:
- Take your total ad spend for last month.
- Count the leads that channel produced.
- Count how many of those you actually reached and spoke with.
- Count how many turned into a job on the calendar.
- Divide spend by that last number.
Expect the result to be several times your cost per lead. If you’re paying $90 a lead and you book one in four, you’re at $360 a booked job, and now the only question that matters is what a job is worth to you. A $9,000 roof, that’s a great trade. A $180 service call, you have a math problem.
Most of the damage happens on step three. Leads nobody called back inside five minutes, calls that went to voicemail during a job, forms that landed in a spam folder, callbacks promised on a Friday and made on a Tuesday. That gap is almost never an advertising problem, and no amount of bid optimization fixes it. The seven numbers worth putting on a monthly report starts with this one for exactly that reason.
What “too expensive” really means for a Triangle business
Raleigh is a mid-size metro, not New York. Costs here run below Atlanta and DC and above rural eastern North Carolina, which puts most Triangle accounts near the national median rather than far above it.
The competitive pressure is real, though. Raleigh-Cary ranks fourth among large US metros for small business growth. Every month there are more roofers in Wake Forest, more dentists in Apex, more pest control routes in Clayton and another HVAC company hanging a shingle in Holly Springs, all bidding on the same keywords you are. Clicks in the Triangle are not getting cheaper.
So “too expensive” isn’t a number. It’s a ratio. A lead at $130 is a bargain for a firm signing a case worth five figures and a disaster for a business doing $200 tune-ups. Work out what a booked job is worth to you, decide what you’re willing to pay to get one, and then compare that to what you’re actually paying. Everything else is noise.
If you’re not sure what your ceiling should be, our post on how much a Raleigh small business should spend on marketing works through the budget side of the same math.
Rather see the work than read about it?
Our Google Ads management page lays out exactly what we do every month, what we report, and what you keep if you ever leave. No lock-in contracts and no mystery line items on the invoice.
See how we run Google AdsOr book a 20-minute call and bring your last invoice. We’ll tell you what we’d change.Frequently asked questions
Is $130 a lead too much for my business?
If you’re a personal injury firm, that’s roughly the national median at $131.63. If you’re a plumber, it’s about 40% above the home services median of $90.92 and worth an account review this week.
Why is my cost per lead higher than the benchmark?
Usually one of four things: no negative keywords, broad match paired with the wrong bid strategy, ads pointing at your homepage instead of a service page, or leads being counted that were never really leads.
Do these benchmarks apply in Raleigh?
Directionally, yes. Metro cost per lead runs meaningfully above rural, and Raleigh sits mid-pack, cheaper than Atlanta or DC and more expensive than eastern North Carolina.
What should I be measuring instead of cost per lead?
Cost per booked job. Take total spend and divide by the jobs actually put on the calendar. That number is usually several times your cost per lead, and it’s the one that tells you whether to keep going.
My category isn’t in the table. What do I use?
Pest control and home security track closest to home and home improvement at $90.92. Audiology and chiropractic track closest to physicians and surgeons at $40.04, though that’s better treated as a floor than a target.
Why did my cost per lead go down this year?
Across Google and Microsoft Ads, 2026 is the first year in five that average cost per lead declined, and it happened through better conversion rates rather than cheaper clicks. Dental cost per lead fell 13.1% while dental conversion rate rose 17.5%.
Benchmark figures current as of the WordStream/LocaliQ 2026 report, covering April 2025 through March 2026. We update this post when the benchmarks refresh.