
How to Read a Google Ads Report Your Agency Won’t Explain
Nine things to check inside your own Google Ads account, with the exact menu paths. If the report and the platform disagree, the platform is right.
Close the PDF. Open the account.
That’s the whole method. Every agency report is a design decision. Somebody chose which numbers go on page one, which column they came out of, and what got left off. Google’s interface wasn’t built to flatter anyone. So when the dashboard and the platform disagree about the same date range, the platform is right and the dashboard is marketing.
You don’t need to know Google Ads to do this. You need read-only access and thirty minutes.
The fastest way to find Google Ads report red flags is to stop reading the report and open the account. Check the conversion actions first, then which conversion column the report pulled from, then the search terms you actually paid for. If your agency’s dashboard and Google’s interface disagree for the same date range, Google is right.
Check zero: get read-only access
If you don’t have a login, ask for one first. Your agency goes to Admin, then Access and security, then the plus button, and adds your email at the “Read only” level. Ninety seconds, and they keep full control. If that request turns into a conversation, you’ve already learned something.
Google Ads report red flags: the nine checks, listed
Run them in this order. The first two catch most of it, and they take about four minutes between them.
- Conversion actions: how many things get counted as a “conversion”
- “Conversions” vs “All conversions”: which column the report used
- The search terms report: what you actually paid for
- Negative keywords: when anything was last added
- Branded vs non-branded spend
- Impression share, the metric that always improves
- Quality Score distribution
- Auto-applied recommendations
- Change history: who touched the account last month
1. Conversion actions: how many things are counted, and is any of it the same event twice
Left menu: Goals, then Conversions, then Summary. Older account layouts put it under Tools and settings, then Measurement, then Conversions.
Two columns matter. “Include in ‘Conversions'” is a yes or no per row, and every yes gets added into the number printed on your report. “Count” is set to either Every or One.
Now read the names. A normal service account has a form submit, a call from ads, a call from the website, a click-to-call tap, sometimes a chat open, sometimes a thank-you page view. One homeowner in Apex who fills out your form, hits the thank-you page and then taps your number lands in that column three times.
Then check Count. “Every” means the property manager who calls four times in March counts as four conversions. “One” counts her once. For lead gen, most actions belong on One.
Brad Geddes, co-founder of Adalysis: “If your tracking is inconsistent, your entire account data becomes skewed.”
2. “Conversions” vs “All conversions”: which column the report used
Go to Campaigns, then Columns, then Modify columns, then Conversions. You’ll see both “Conversions” and “All conv.” available.
They are not the same number. “All conversions” includes actions somebody deliberately excluded from the primary column, usually the softer stuff nobody would call a lead. If your report says 62 and the account says 41, go look for a 62 under “All conv.” That isn’t a bug. Somebody picked that column.

3. The search terms report: what you actually paid for
Campaigns, then Insights and reports, then Search terms. Set the date range to the last 90 days and sort by Cost, highest first.
Read the top thirty out loud. Not the keywords your agency bought, the phrases people typed. This is where you find out you’re paying $8.33 a click in home services for “hvac technician salary” and “how to fix my own furnace.”
4. Negative keywords: when was anything last added
Campaigns, then Audiences, keywords and content, then Search keywords, then the Negative keywords tab. Also check Tools, then Shared library, then Exclusion lists.
An empty or ancient list is the clearest sign nobody opens this account. A quarter of accounts have never added a single negative keyword, and accounts with at least one average a 13% monthly conversion rate against 4.6% for accounts with none. Geddes again, from the same piece: “In almost every audit I conduct, I see negative keyword conflicts… Some negative keyword lists are over a decade old.”
5. Branded vs non-branded spend: how much of your “performance” is your own name
Back in the search terms report, filter to Search term contains your company name. Note the clicks, cost and conversions, then compare that block to everything else.
Branded clicks are cheap and they convert beautifully, because the person typing your name already decided to call you. They saw your truck in Wake Forest, or a neighbor passed your number along. Those conversions belong on the report. They don’t belong in a sentence about how well the ads work. If half your leads came from people searching your own name, you paid a toll on a call you’d already earned.
6. Impression share: the metric reports love because it always improves
Columns, then Modify columns, then Competitive metrics. Turn on Search impression share, Search lost IS (budget) and Search lost IS (rank).
Impression share is real and close to useless by itself. You can hold 90% impression share on phrases nobody who needs a plumber ever types. And “Search lost IS (budget)” always shows a gap, which is why it lands right before the paragraph asking for more money.
Read it beside conversions and cost per lead or don’t read it. If impression share climbed while leads sat flat, you bought more of something that wasn’t working.

7. Quality Score distribution
Search keywords, then Columns, then Modify columns, then Quality Score. Add Quality Score, Exp. CTR, Ad relevance and Landing page exp.
Sort low to high. Quality Score runs 1 to 10 and drives what you pay per click, so a pile of 3s means you’re funding a discount for whoever ranks above you. It’s common: 36% of accounts average below 4, and only 3% reach the top band. Common doesn’t mean acceptable when you’re the one paying.
If Ad relevance and Landing page exp. read “Below average” down the whole column, nobody has rewritten an ad or touched a landing page in a long time.
8. Auto-applied recommendations: who switched those on
Campaigns, then Recommendations, then the Auto apply tab (top right, sometimes under the three-dot menu).
This screen tells you who is actually running the account. If a stack of these is on, Google’s automation is adding keywords and raising budgets with nobody reviewing it first.
The one to look for
“Add new keywords” quietly widens what you’re paying for. If your management fee covers keyword strategy and Google is generating the keywords for free, ask what the fee is buying.
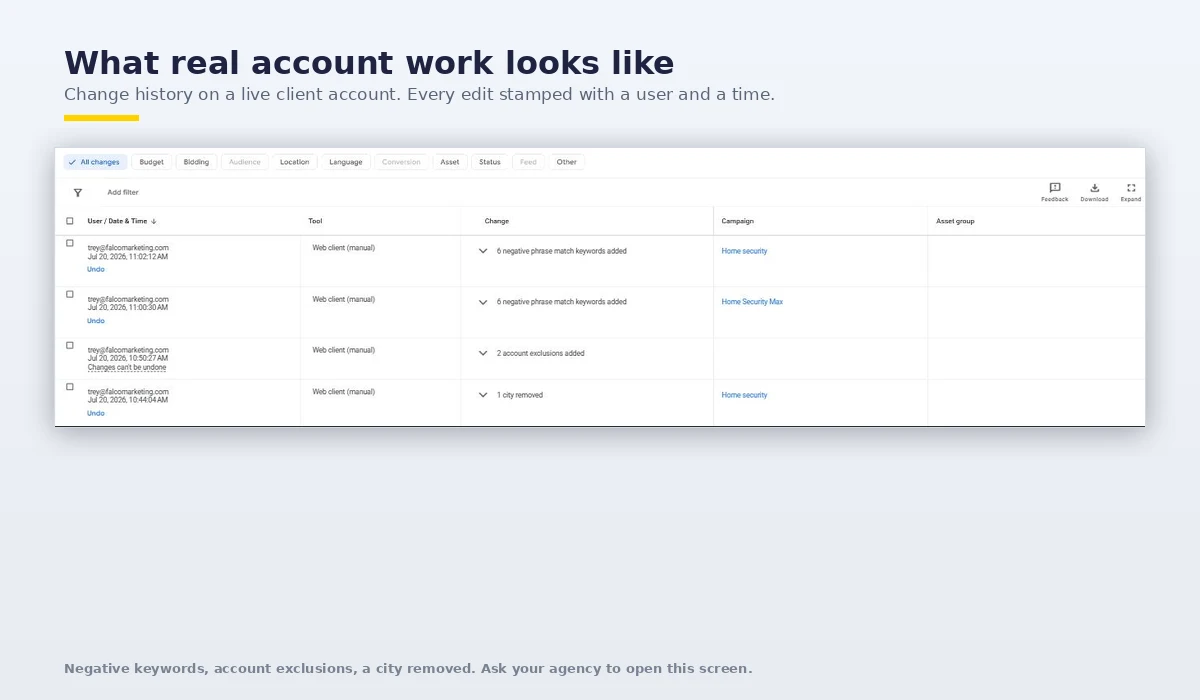
9. Change history: how many times anyone touched the account last month
Tools, then Troubleshooting, then Change history. Set the date range to last month and filter by user.
Ignore the automated rows. Count human edits: new negatives, new ad copy, paused keywords, bid changes. A small account under real management shows meaningful edits most weeks. Two logins in thirty days, both budget adjustments, is a retainer paying for nothing.
The two structural tricks
Both are legal, ordinary and almost never explained to the person paying. They sit on the r/PPC list of agency red flags as “double counting conversions” and “inflating or focusing on vanity metrics.”
Counting the same person twice. Check 1 catches it. When a form fill, a thank-you page view and a phone call all count, your 40 conversions might be half that many humans. Nobody typed a false number. The report just never mentions the overlap, and an owner reading “40 leads” reasonably assumes forty people.
Taking credit for your own name. Check 5. Branded search is the cheapest, highest-converting traffic in any account, and folding it into one blended cost per lead makes the program look sharper than it is. An owner on r/PPC described where that ends up:
for months we thought we were hitting 3.0 ROAs when in fact it was closer to 1
— Owner, r/PPC, September 2024
One more to check if you run Performance Max next to Search. Optmyzr studied 503 accounts and found exact keyword overlap in 91.45% of them. You can pay twice for one auction and see it reported as two wins.
Then there’s the version that isn’t subtle. A small business owner on a national vendor’s dashboard: “the numbers in Hibu’s visually appealing dashboard did not align with actual Google data”. His next two words were “nowhere close.” His site drew 32 visitors in four-plus months under that vendor, against 1,427 sessions in the three months before, and over 120 pages carried identical metadata. When he brought a 40-page evidence packet to the meeting, the vendor blamed heavier-than-usual snowfall.
Send us your last report and we’ll translate it
Email us the monthly PDF your agency sent you. We’ll mark it up line by line and send it back: what each number measures, which ones can’t be verified without account access, and the three we’d ask about first. Takes us a day. We do this for owners with no intention of switching, and plenty of the reports we read come back fine.
Send us your reportPrefer to start inside the account? Here’s what a Google Audit covers.When the numbers genuinely don’t match
Be fair here. There are real reasons a platform number and your booking software will never agree, and an agency that explains them isn’t dodging you.
Conversion lag is the big one. Ginny Marvin, Google’s Ads Product Liaison, names two causes: “1) from the time it takes for a user to perform the action after seeing the ad and 2) the data processing and attribution lag.” Somebody clicks your roofing ad Tuesday and calls the following Monday. Google credits Tuesday. Your CRM logs Monday.
Tracking breaks too. Frederick Vallaeys, co-founder of Optmyzr, on why: “Click IDs sometimes never reach the site, or they disappear before a conversion occurs.”
So the tell isn’t a gap. The tell is what happens when you point at it. A good partner names the cause and shows you the screen where you can see it. The pattern we hit most on audits is the other one, a confident explanation with nothing behind it. The extreme version is on public record in a client review of a national vendor, who wrote that they were “charged me over $10,000 and told me they could not tell me what the charges were for.”
What a report should show instead
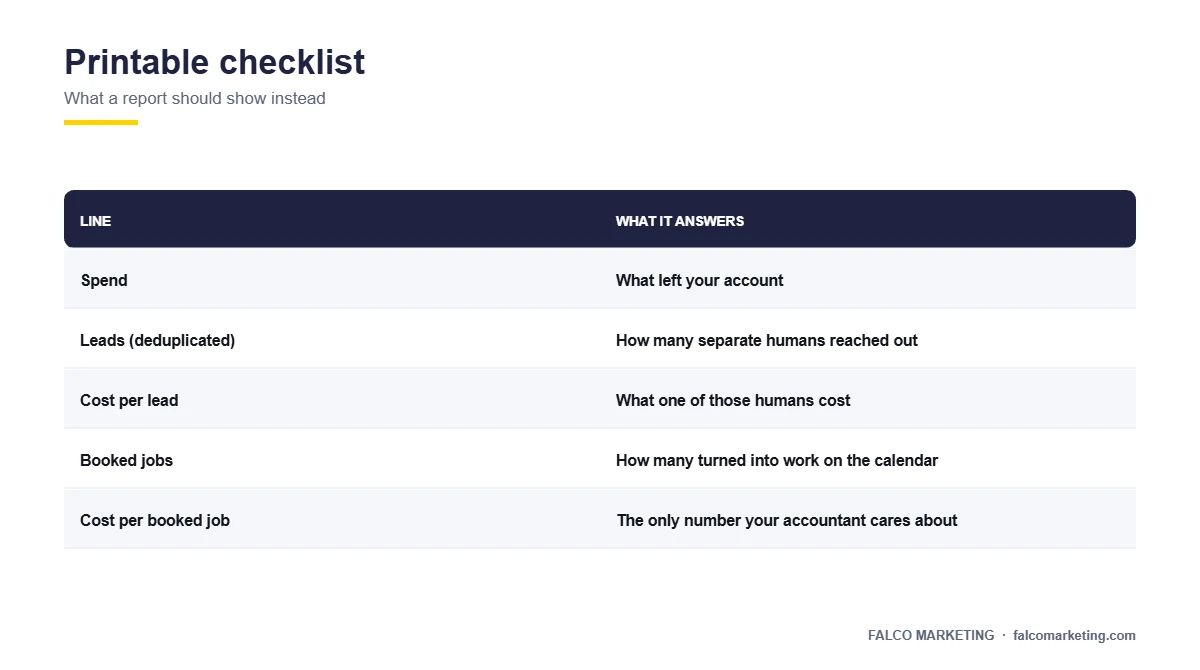
Five lines, every one of them tied to money you can count in the bank:
| Line | What it answers |
|---|---|
| Spend | What left your account |
| Leads (deduplicated) | How many separate humans reached out |
| Cost per lead | What one of those humans cost |
| Booked jobs | How many turned into work on the calendar |
| Cost per booked job | The only number your accountant cares about |
Caption: The five lines that make a Google Ads report readable in ninety seconds.
The median cost per lead across all industries is $66.69, running to $90.92 in home improvement and $131.63 for legal. Those are medians, not targets. What matters is whether your cost per booked job leaves room for profit at your average ticket, which is why we walk through cost per lead by industry and the seven numbers a report should contain with every owner we take on.
Everything past those five lines is context, not performance. Impressions and Quality Score belong in the account, where you can go look at them.
The email to send your agency
You don’t need to accuse anybody. Send this and read the reply.
- Which conversion actions are included in the “Conversions” column on our report, and do any of them fire for the same person on the same visit?
- Of last month’s leads and spend, how much came from searches containing our business name?
- Can you send me a screenshot of change history for last month, filtered by user?
An agency doing the work can pull all three in ten minutes, and a straight answer, even an unflattering one, is a decent sign. A meeting invitation instead of an answer is also a sign.
If the reply is a refusal on access, read what your marketing company should hand over if you fire them tomorrow first. Owners across Raleigh, Cary and Fuquay-Varina find out too late that the account, the conversion tags and the history were never in their name.
Frequently asked questions
My agency won’t give me access to the account. What now?
That’s the finding, not an obstacle. Read-only access costs them nothing and takes ninety seconds to grant. Refusal answers the question you were asking.
Google says 40 conversions and I booked 6 jobs. Who’s lying?
Probably nobody. Conversions usually count form fills, calls over 30 seconds, chats and clicks-to-call as separate events, and some of those are the same person twice. Ask which actions are included and whether any of them overlap.
Is impression share a real metric?
It’s real and nearly useless on its own. You can hold 90% impression share on terms that never convert. Read it next to conversions and cost per lead, never alone.
How often should someone be working on my account?
Check change history. A well-run small account gets meaningful human edits most weeks. Once or twice a month, both times a budget nudge, is a very different service than the one in your proposal.
Can I run all nine checks with view-only access?
Yes. Every screen here is readable at the “Read only” level, and you can’t change anything, which is the point.
Or hand us the account for a week
Give us read-only access and we’ll send back a one-page benchmark: your cost per lead against your industry median, how much of your spend went to branded search, and the biggest waste in your search terms report. No proposal, no follow-up sequence, and you keep the document whether or not we ever speak again.
Get a Google AuditWe manage Google Ads for service businesses across the Triangle, from Apex to Wake Forest.